Bearish Flag Pattern
Learn the bearish flag continuation pattern: how to identify, trade, and avoid common mistakes. For intermediate traders.
Mark · Trader & Founder, Social Forex
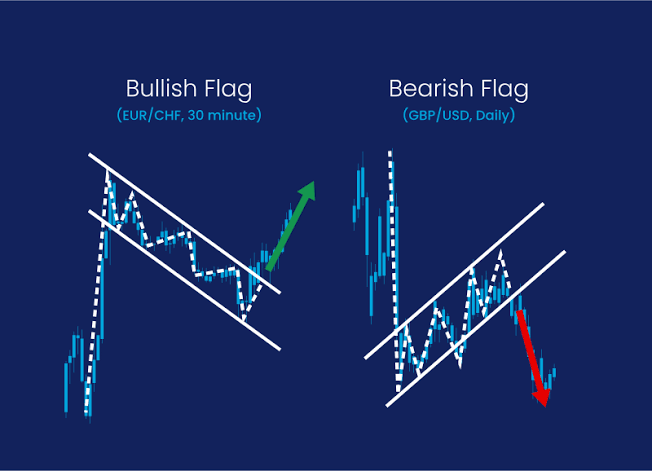
Bearish Flag Definition
The Bearish Flag is a bearish continuation pattern. It forms after a sharp downtrend (flagpole) and a consolidating upward move (flag). When price breaks below the flag's support, the downtrend resumes.
How to Identify
- Flagpole: A strong downward move with large candles and increasing volume.
- Flag: An upward (or sideways) consolidation with small candles, usually decreasing volume. The flag should slope upward (no more than 45 degrees) or be flat.
- Breakout: Price breaks below the flag's lower trendline with increased volume.
Overall shape: A steep down move, then a small rising channel, followed by a breakdown.
The flag often consists of many small-body candles (inside bars) within a narrow range, showing hesitation. [diagram:generic-chart]
How to Trade
- Entry: Place a sell order as soon as the candle closes below the flag's support (breakout). You can wait for retest for a better risk/reward.
- Stop Loss: Above the highest high of the flag (1-2 ATR).
- Take Profit: Measure the flagpole height (from high to low of the flagpole) and add it to the breakdown point. Alternatively, use Fibonacci extensions (127.2% or 161.8%).
Real Example: On EUR/USD H4, Oct 15 2023: price fell from 1.0600 to 1.0500 (100 pips) — flagpole. Then an upward flag formed over 3 days from 1.0500 to 1.0550. When price broke below 1.0500, you took a sell. Stop loss at 1.0555. Target: 1.0400 (1.0500 - 100 pips). Price reached 1.0380.
Common Mistakes
- Confusing with reversal: If the flag slope is too steep or volume increases during the flag, it may be a reversal. Always check volume.
- Entering too early: Not waiting for a confirmed breakout candle. This leads to false breakouts.
- Ignoring stop loss: The flag may fail if price breaks above the flag's high. Always set a stop.
- Volume not confirming: If the breakout has low volume, it's likely false.
Conclusion
The Bearish Flag is a reliable pattern when combined with volume analysis and proper risk management. Practice on higher timeframes (H4, D1) for better success rates.
Content is for reference only, not investment advice. Forex trading carries high risk.
Save your learning progress
Create an account to keep lessons, watchlist symbols, and journal notes connected as you practice.