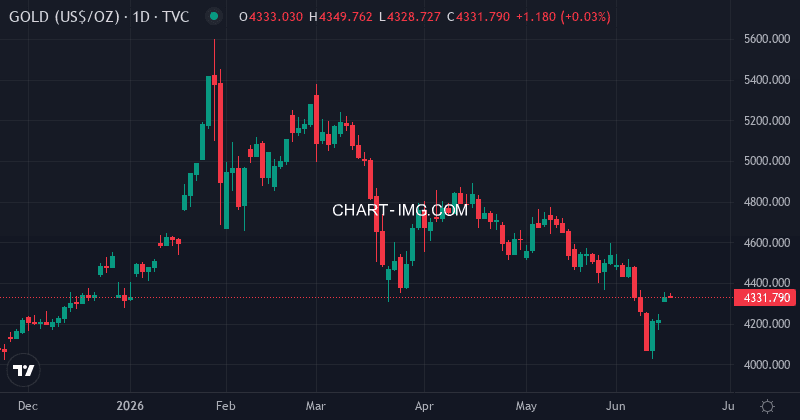
Introduction to XAUUSD
The XAUUSD is trading at $4331.65300, with a mixed EMA bias, as indicated by the EMA20=$4337.04883, EMA50=$4336.24010, and EMA200=$4313.22225. The RSI is at 42.9, indicating a bearish trend.
Why this Matters for Traders
The current price action and technical indicators suggest that traders should be cautious, as the mixed EMA bias and bearish RSI may indicate a potential downtrend. However, the recent US CPI print and expected rate cuts in July 2026 have supported gold prices, making it essential for traders to stay up-to-date with the latest market news.
Technical Analysis Breakdown
The technical analysis indicates a bearish trend on the M15 chart, with a close of $4331.65300 and an RSI of 42.9. The EMA20, EMA50, and EMA200 are $4337.04883, $4336.24010, and $4313.22225, respectively. On the H1 chart, the trend is neutral, with a close of $4331.65300 and an RSI of 50.5. The EMA20, EMA50, and EMA200 are $4333.58074, $4313.90488, and $4305.77232, respectively.
Practical Checklist
Traders should watch the following levels and indicators:
- EMA20: $4337.04883
- EMA50: $4336.24010
- EMA200: $4313.22225
- RSI: 42.9
- MACD: negative cross
- Candle pattern: doji / indecision
Common Mistakes Traders Make
Traders often make the mistake of not verifying data on their broker platform, economic calendar, and chart. It is essential to stay up-to-date with the latest market news and technical analysis to make informed trading decisions.
Risk Management
To manage risk, traders should:
- Set a stop-loss at a reasonable distance from the entry point
- Use position sizing to limit exposure
- Follow capital rules to avoid over-leveraging
- Stay informed about market news and technical analysis
Risk Disclaimer
This article is for educational purposes only and should not be considered as financial advice. Trading in the foreign exchange market involves risks, and traders should always verify data on their broker platform, economic calendar, and chart before making any trading decisions.