What Is Happening Right Now
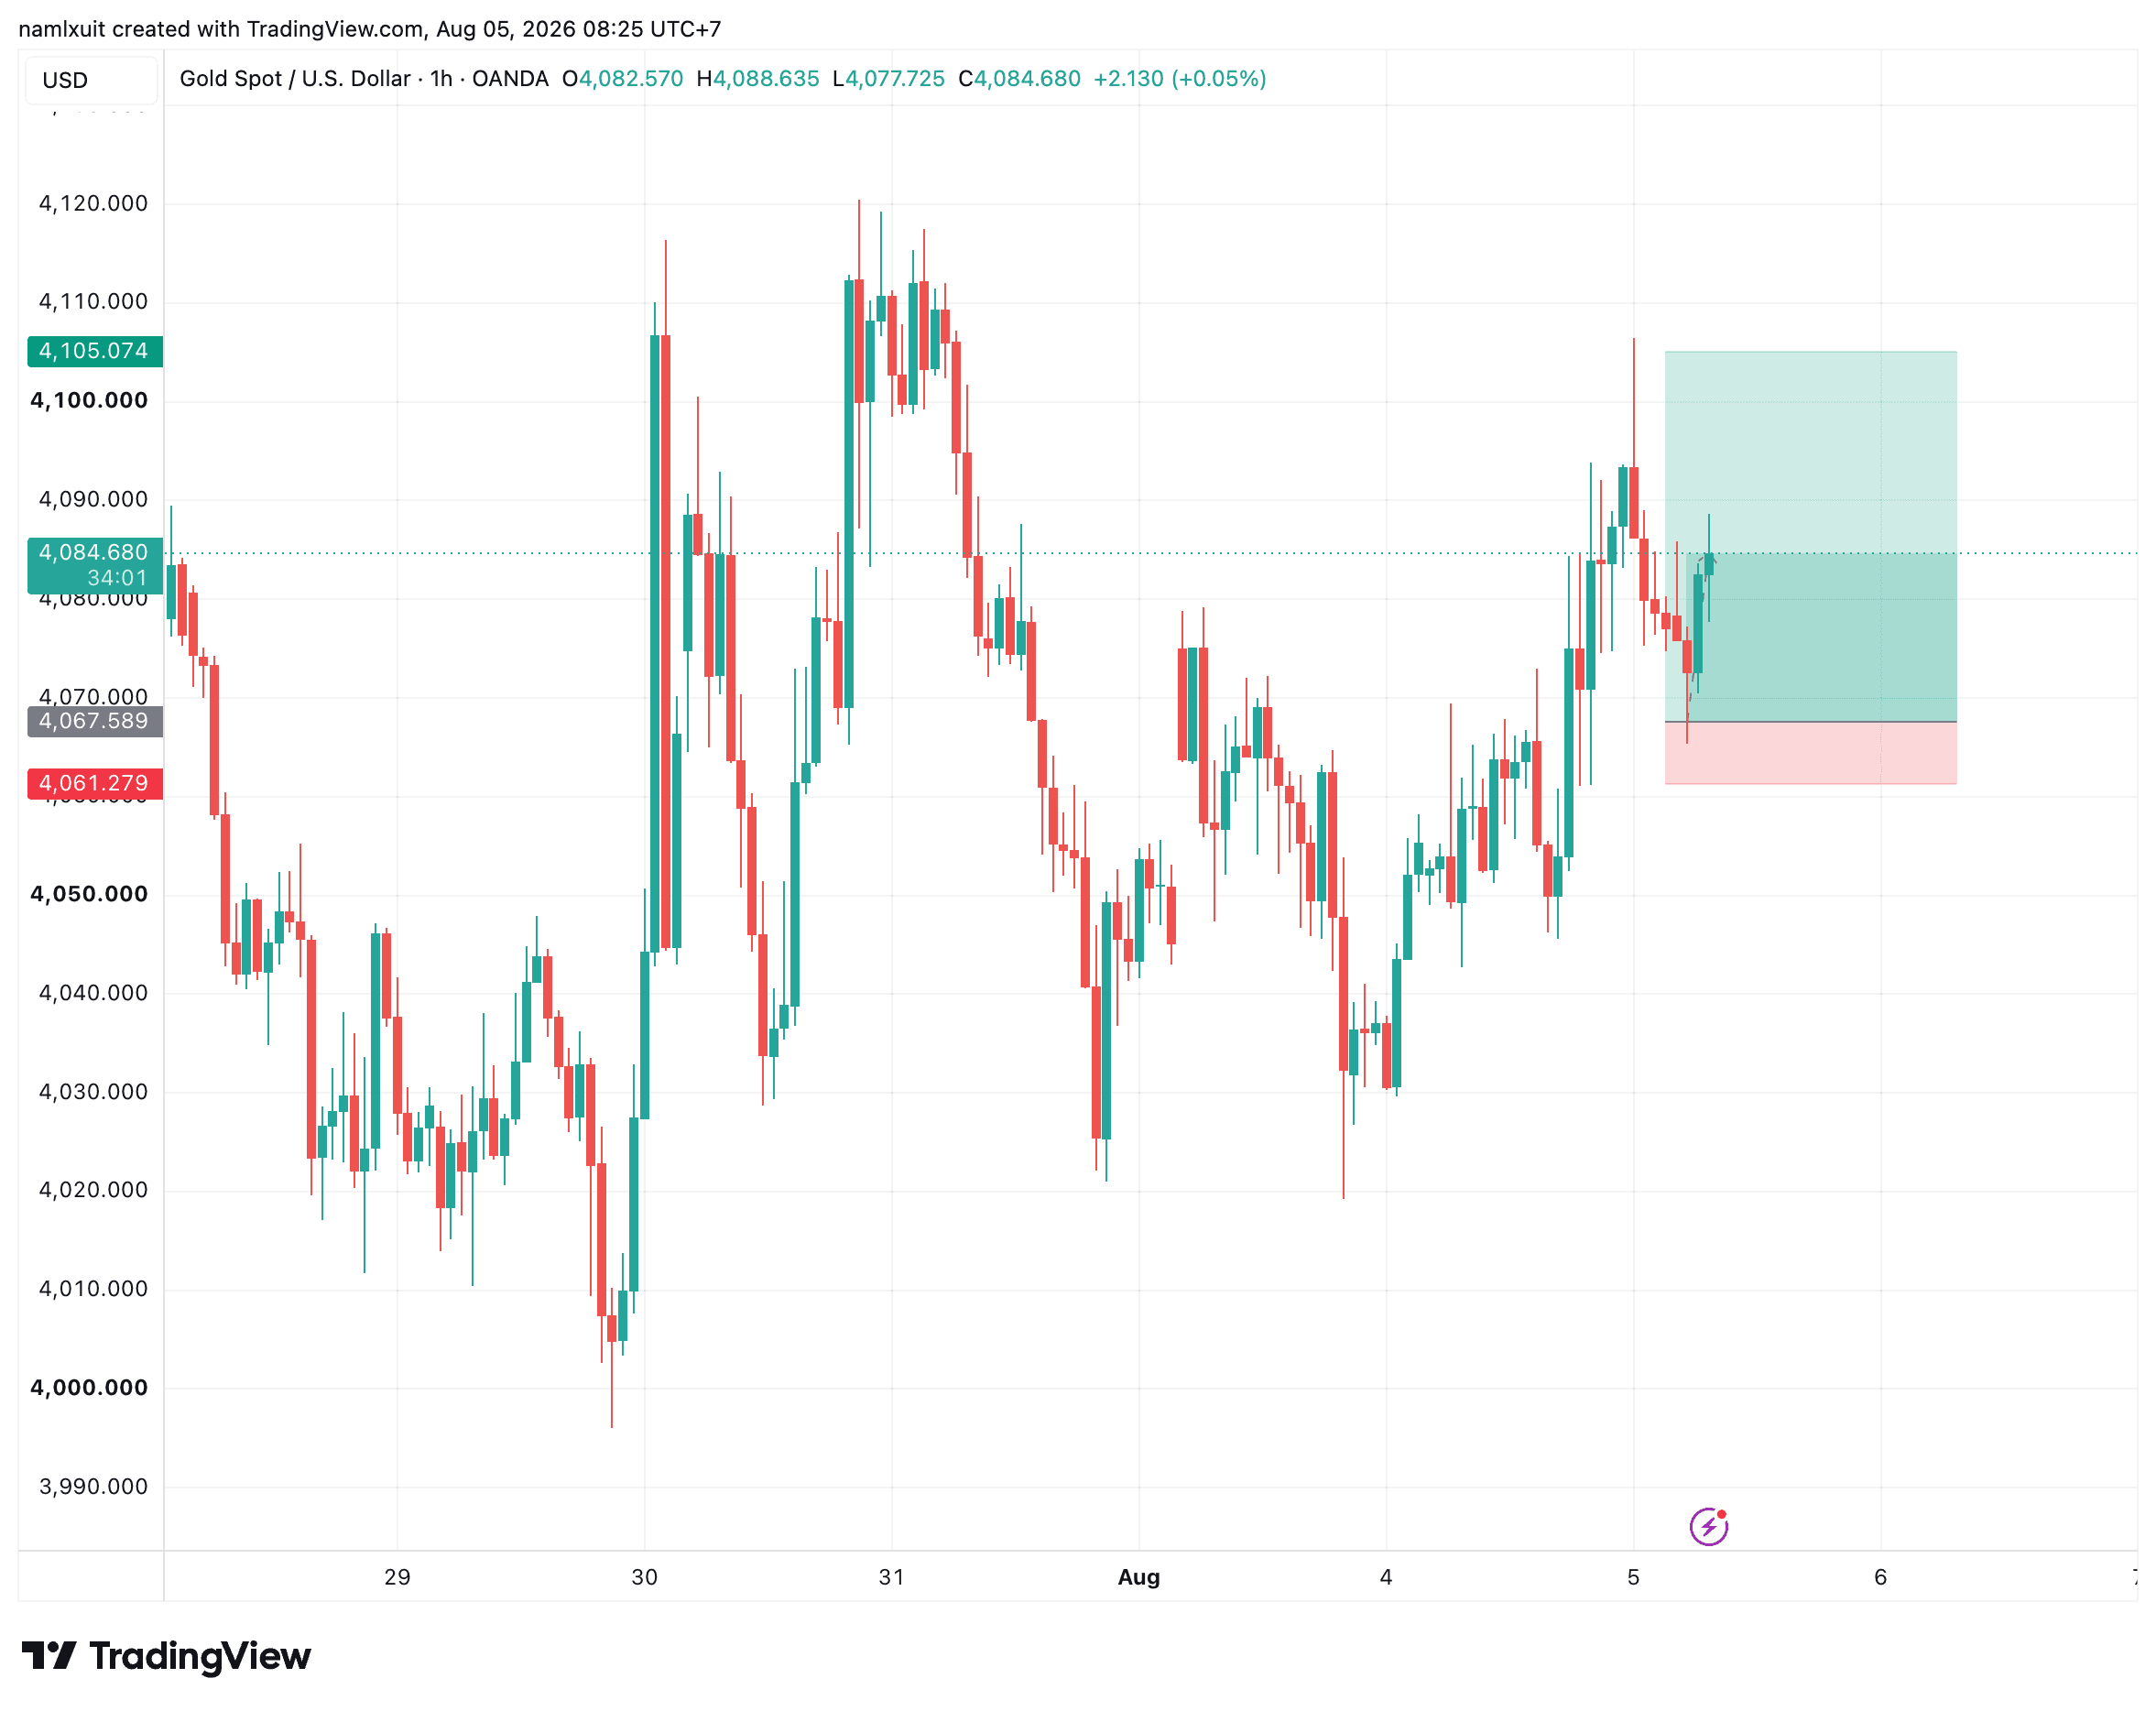
XAUUSD is trading at 4086.56 as of early Asian session on August 5, 2026. The price posted a modest 0.02% gain on the 15-minute chart, accompanied by mixed technical signals. Short timeframes (M15, H1, H4) show a bullish lean, with price above their 20-period and 50-period exponential moving averages. However, the daily chart remains neutral, with the price stuck below the 100- and 200-day moving averages. Recent news highlights a market awaiting the Federal Reserve's next move and possible breakout after weeks of consolidation (FOREX.com, FXStreet). The 4-hour chart shows a hammer-like rejection from near the EMA20 (4064.41), indicating buyer interest at lower levels.
Why This Matters for Traders
This tug-of-war between short-term momentum and longer-term resistance creates a high-stakes environment. A sustained break above 4100 could open the door toward the critical 4116 level (H4 EMA200), while failure to hold above 4065 might signal a deeper pullback. Traders are closely monitoring whether gold can escape its six-week consolidation range, as the outcome may set the trend for the coming week.
Technical Analysis Breakdown
- RSI readings: M15 at 59.3, H1 at 60.5, H4 at 56.2, and D1 at 49.1. The first three are in bullish territory (above 50 but not overbought), while the daily RSI sits exactly on the 50 midline, reflecting indecision.
- EMA alignment: On H1, the 20 EMA (4074.43) and 50 EMA (4066.74) are both sloping upward and are below price, forming a short-term support stack. The H4 chart shows the 20 EMA (4064.41) and 50 EMA (4061.24) also sloped upward but the 200 EMA (4116.58) looms overhead as resistance. The D1 EMAs are mixed: price is above the 20 EMA (4077.20) but below the 50 EMA (4187.03) and 200 EMA (4276.67) — a sign of a downtrend on the daily.
- Momentum: MACD gives conflicting signals: positive cross on M15, H4, and D1, but a negative cross on H1. ADX values are low to moderate: M15 16.5, H1 22.2, H4 11.9, D1 23.9 — indicating no strong trend. The low ADX on H4 suggests a lack of momentum despite the bullish bias.
- Key levels: Support at 4065-4075 (confluence of H1 EMA50, H4 EMA20/50); resistance at 4090-4100 (psychological round number) and 4116 (H4 EMA200).
Technical Bias & Probability
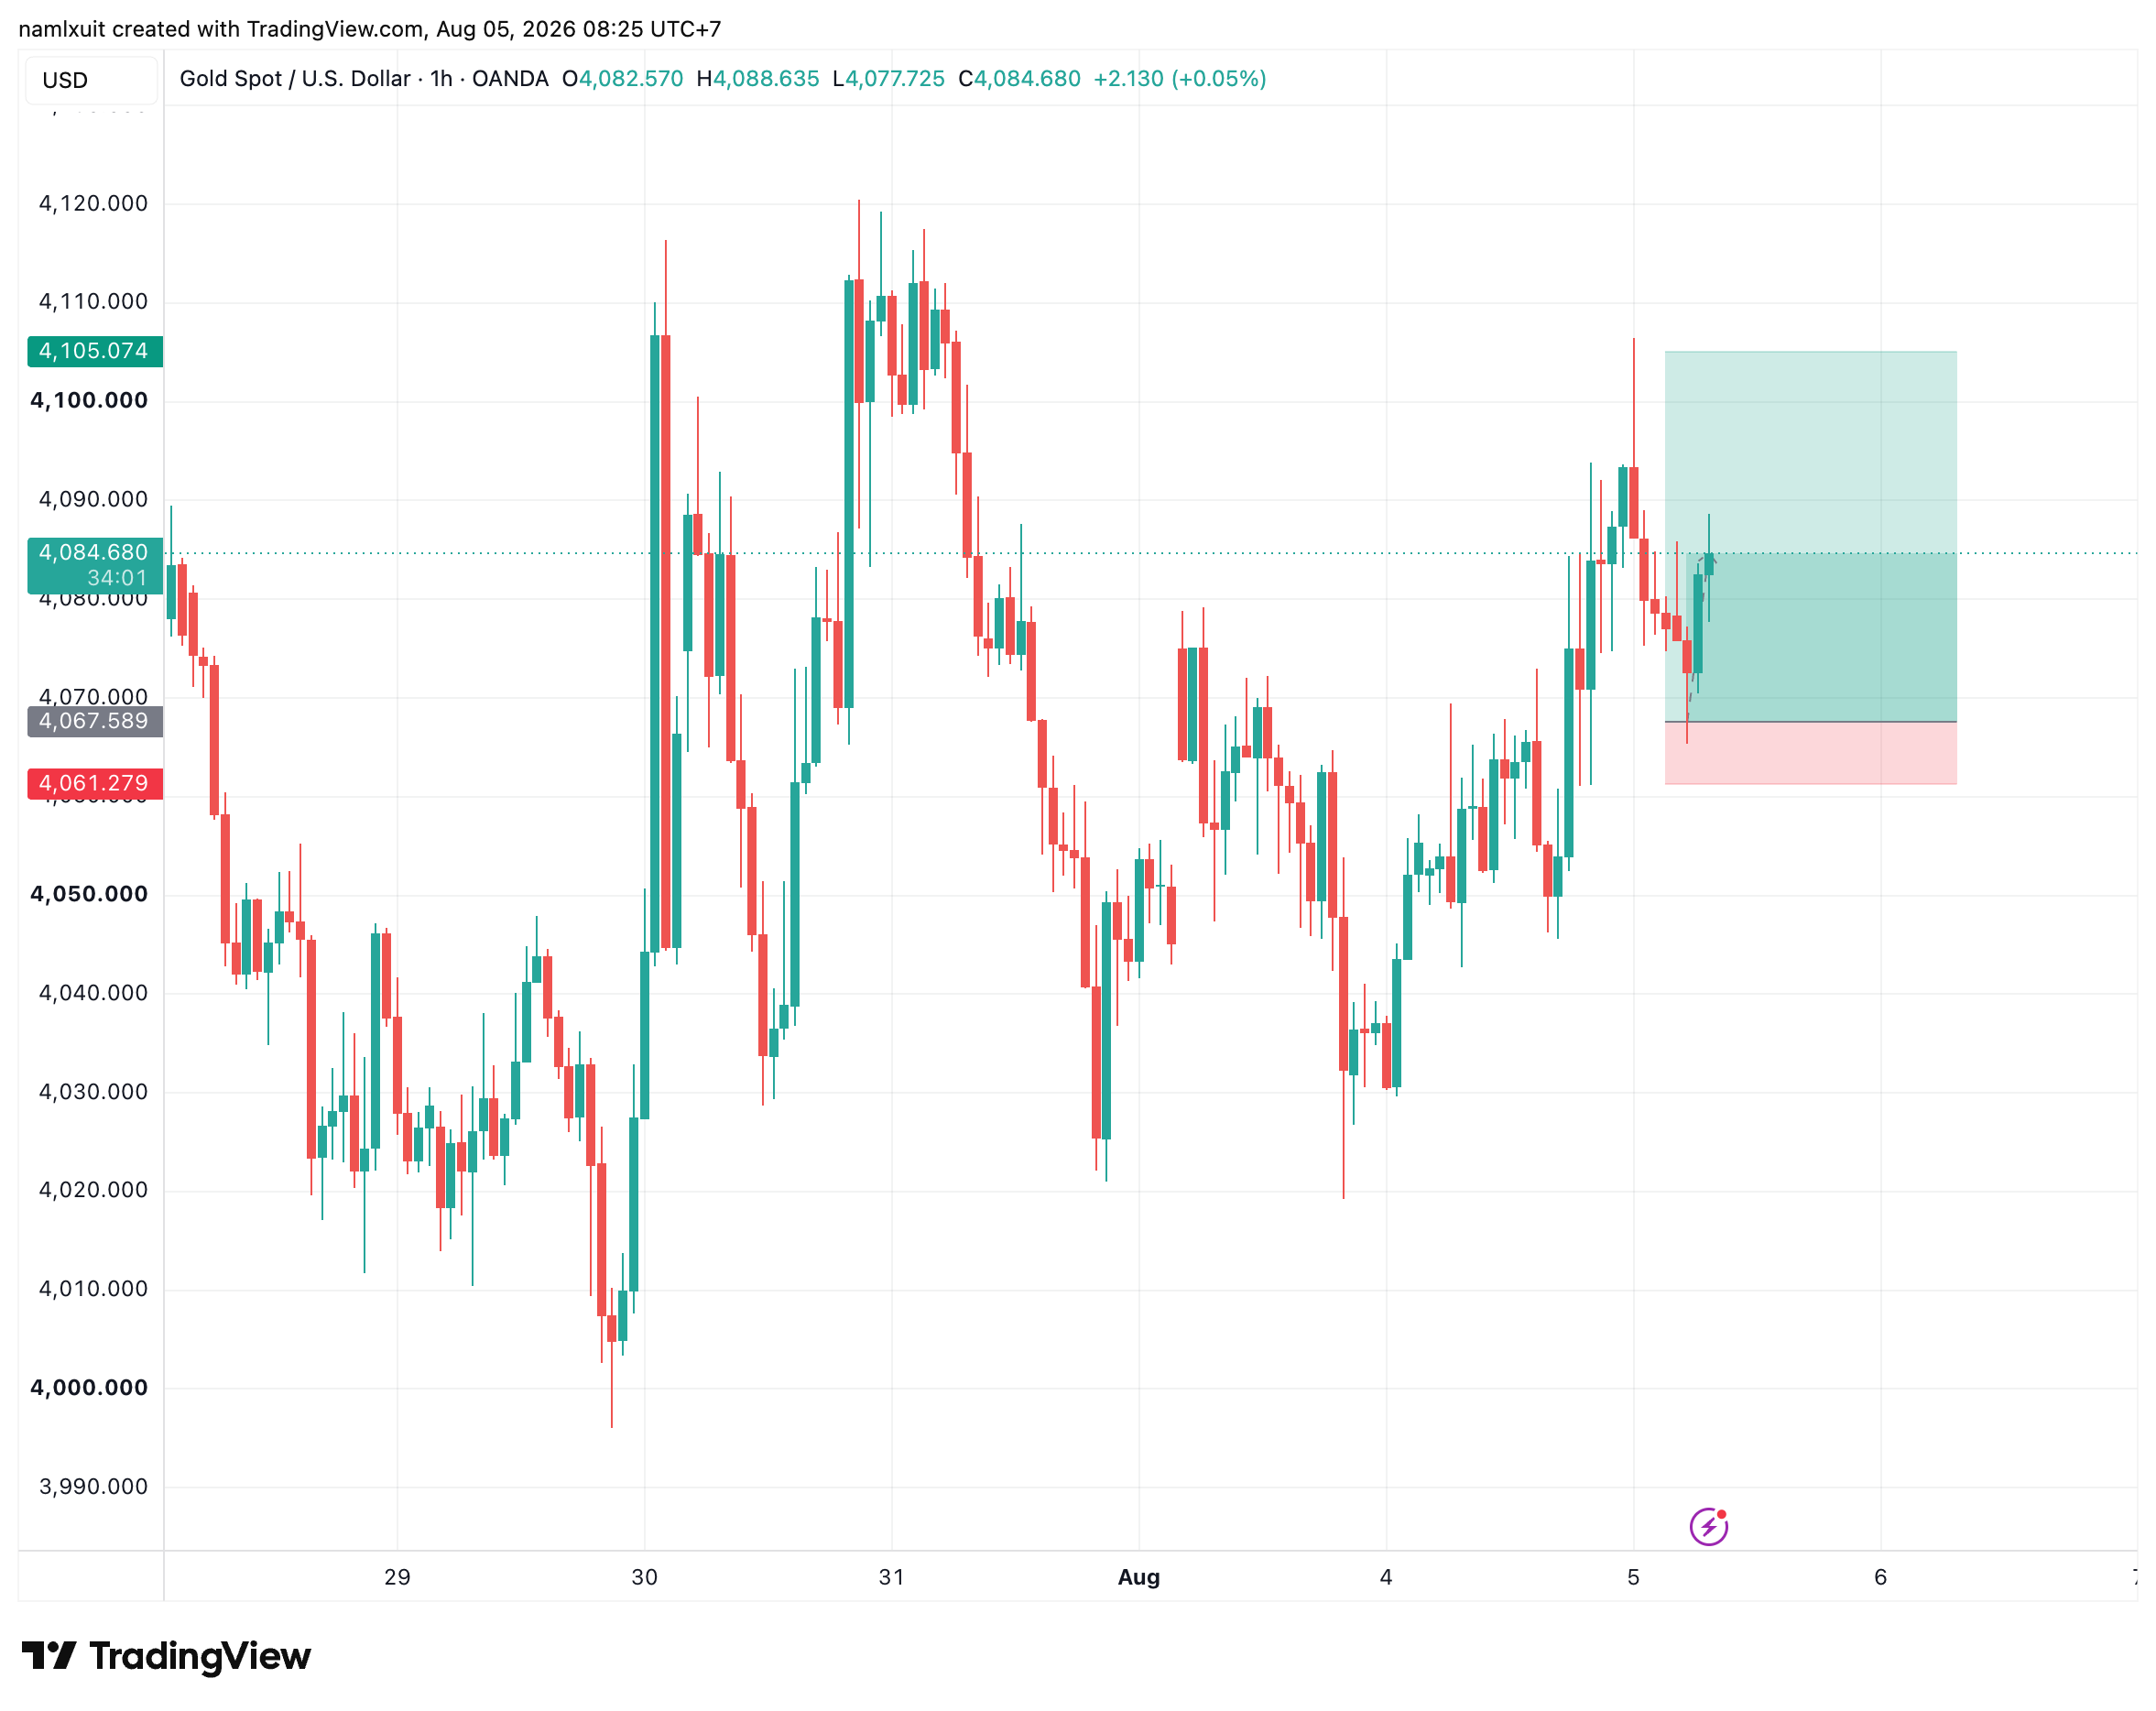
Bias: BUY (65% confidence)
| Entry Zone | Invalidation Level |
|---|---|
| 4065 – 4075 | Below 4060 |
This bias is driven by the bullish alignment on lower timeframes: M15, H1, and H4 RSI are all above 50, H1 and H4 EMA stacks are positively sloped, and price holds above these short-term EMAs. However, the conflicting daily neutral picture (mixed EMAs, RSI at 50) and mixed MACD signals cap our confidence at 65%. The entry zone is designed to buy on a pullback to a high-confluence support area formed by the H1 EMA50 and H4 EMA20/50, which historically offers better reward-to-risk than chasing price near resistance. A move below 4060 would invalidate the near-term bullish thesis. This is a technical-analysis-only read, not investment advice. The zone is not a guarantee of a fill or a win, and you must apply your own stop-loss and position sizing.
Practical Checklist
- Monitor H1 candle closes relative to EMA20 (4074) and EMA50 (4067) for early signs of strength or weakness.
- Watch for a break above 4100 on rising volume; failure to clear this level could lead to a retest of the 4065-4075 zone.
- Check the economic calendar for any Fed speeches or US data releases that could inject volatility.
- Verify price levels on your own broker platform, and adjust entry zones based on your chart’s exact moving average values.
Common Mistakes Traders Make
- Chasing price after a sudden spike without waiting for a pullback to key support, which often leads to poor risk-reward.
- Ignoring the higher timeframe (daily) which signals a longer-term downtrend – a bullish short-term trade must be managed carefully.
- Overleveraging due to seemingly strong short-term signals, forgetting that low ADX readings point to a lack of trend conviction.
Risk Management
- Place a stop-loss just below the invalidation level (e.g., 4059) to cap downside, ensuring the distance is less than your profit target.
- Use a position size that risks no more than 1-2% of your account on this trade. For example, if your stop is $20 away, limit lot size accordingly.
- Consider scaling into the entry zone with partial orders rather than a single full position, to average a better price if volatility spikes.
Risk Disclaimer
This article is for educational purposes only and does not constitute financial advice. Trading forex and commodities like gold involves substantial risk and is not suitable for all investors. Past performance and technical patterns do not guarantee future results. Always do your own research and consult with a licensed financial advisor before making any trading decisions.